Register with Plumtri!
Register on plumtri as an Individual or as an Organisation to gain access to all of its useful features and remain updated on the latest R&I news, events and funding opportunities.
-
 Welcome to plumtriA platform for Research & Innovation
 -
 Looking for Funding?Check out the current open calls
 -
 Register today to start receiving our monthly newsletter
 -
 Looking to partner up?Search our list of registered profiles
 -
 You have questions on a particular funding programme?
Project: STREAM

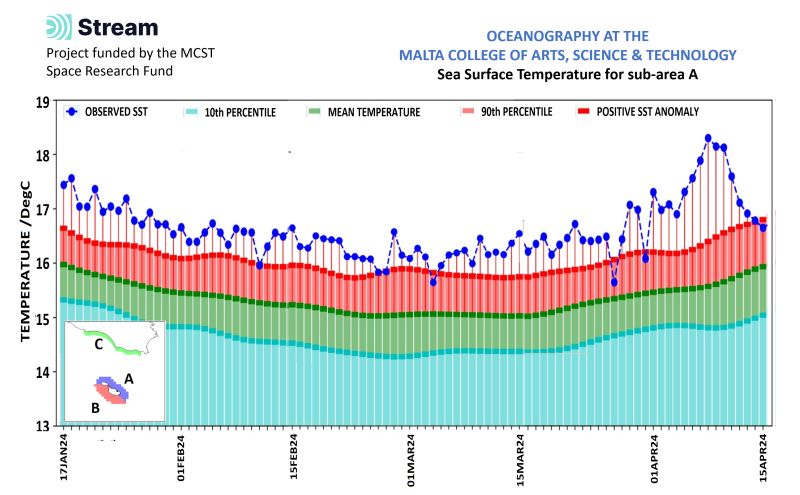
Nothing can disprove what is told by accurate data. This is exactly what we strive to do in the STREAM project, at MCAST. Based on routine observations, we watch and monitor the sea around us to provide information to users in the form of operational assessments of essential marine parameters for the Maltese Islands. One such service is the daily mapping, forecasting and alerting of anomalous sea surface temperature (SST) events as they happen in time and space, with charts and maps showing areas of highest intensity and impact. Running since November 2023, the service is already providing undisputed insights on evident climate change pressures on the marine ecosystem.
The picture is a synthesis of daily SST averages in the last three months. The climatological mean is shown by the dark green plot, following the typical cooling until the end of February; this climatology represents the average over a period of 30 years (Sept1989 to Aug2019). The shaded area in red/green shows the range of SST variability from year to year above/below the mean; the red plot (90th percentile) shows the lower threshold of the top 10% temperatures in the 30 years period. The plot in blue gives the actual SST measurements made this year, and the vertical red lines are the SST anomalies, indicating the amount by which SST is higher than the climatological mean each day. What’s remarkable about this data is not just the temperature anomalies of around 1.4 degC on average higher than the mean, but quite how long they have lasted. Except for a few exceptions we were essentially experiencing marine heatwave conditions since last Summer…..such a long period of practically uninterrupted abnormally hot temperatures. Measured proof that climate change is with us in Malta too.
Click on the below website to read further on this project.
